Background
Metrics ask the same question to multiple companies, measure company performance and facilitate comparison between companies.
Simply, a Metric consists of a Question, it contains an About section explaining the question being asked, and a Methodology section describing how the answers are researched.
When organizing a Research Project for a group of students or researchers, creating Standard Research Metrics is your best option since this type of Metric question asks information that must be researched directly by individuals.
All researched data poitns must cite a Source, and can be verified (checked) by other users.
Note: If after exploring the different Metrics that are available on the Wikirate platform, you find that there aren’t existing metrics capturing information that you consider relevant, you can create a New Metric|New Metric.
Standard Research Metrics
Answers to standard research metric questions are entered either individually via research projects or in bulk by imports. All researched answers must cite a public source and can be verified (checked) by other users.
The standard Answer (Data Point) structure on Wikirate is:

These are the most granular form of the data on Wikirate and are the building blocks for analyses.
Want to design your own Standard Research Metric to capture data that is missing on Wikirate? Check out this step-by-step guide|step-by-step guide.
Calculated Metrics
On Wikirate, Calculated Metrics let you run all kinds of calculations and functions based on data from other Metrics. Just like in Excel or Google Sheets, you can use formulas to arrive at many other helpful values and find interesting insights. In specific, a Calculated Metric refers to the metric type being based on a calculated value, and can come in the form of a Formula, Score, Rating, Descendant, and Network-Aware.
Below, you will find information on the different types of calculated Metrics. We know this can be complicated, so don't hesitate to reach out to us|reach out to us if we can help.
Score Metric
A Score Metric standardizes the answers of another metric to a 0-10 scale. Simply put, you assign a maximum of 10 points to the different answer options of another metric, which can form the basis for any kind of rating.
For example:
|
Answer type |
Number |
Money |
Category |
Multi-Category |
|
Data example |
Greenhouse Gas Emitted (metric tonnes) |
Corporation tax paid (USD) |
Supplier list disclosed |
Whistleblowing mechanism(s) provided |
|
Score example |
0-100k = 10 points 101-200k= 9 points 201-300k= 8 points 301-400k= 7 points 401-500k= 6 points 501-600k= 5 points 601-700k= 4 points 701-800k= 3 points 801-900k= 2 points 901k > = 1 point Unknown = 0 points |
< 0 = 0 points 0-1mln = 2 point 1.1-100mln = 4 points 101-1bln = 6 points 1.1-10bln = 8 points 10.1bln > = 10 points |
Yes = 10 Partial = 5 No = 0 |
Hotline = 2.5 points Email = 2.5 points Anonymous portal = 3.5 points Focal point = 1.5 points None of the above = 0 points |
To create a Score Metric:
-
Select the “Calculations” tab on the page of the Metric you want to Score
-
Click the “Add new score” button. Make sure to check the Score you intend to create does not already exist!
-
Formulate the question that your Score aims to answer
-
Add any relevant Topics tags
-
Explain in the About section, the logic for scoring the Metric answers in this way
-
(optional) If your Score applies exclusively to a select number of Years or a specific Company Group add those
-
(optional) If you are not ready for this Score to be public you can set it to be “unpublished” and simply update that field to “publish” once it’s ready. Do note, that it will not be possible for other users to see or use this Score until it has been published
-
Finally click “Submit”.
Once the Score metric has been created, you can now specify what points you want to assign to the different Answer options.
Click the edit icon
For a metric with Category or Multi-category answers you can now enter the points in the value fields next to the corresponding answer options.
Note: if you want all answer options to be worth the same amount of points, you can tick the “equalize” box.
For a metric with Number or Money answers you can now enter the Formula that determines the answer intervals and corresponding points.
Note: A score’s name is formed by adding the name of the scorer (user, Company or Research Group) to the end of the scored metric.
Rating
A Rating is a 0-10 rating computed as a weighted average of other 0-10 answers. To create a Rating, a number of Score or other Rating metrics are selected and assigned weightings.
For example, this Rating was designed by Fashion Revolution as part of the Fashion Transparency Index and rates a number of Standard Metric Answers that capture the company's approach to purchasing to create a purchasing practices rating|purchasing practices rating.
To create a new Rating, click the ‘Add Metric’ button on the Metrics browse page|browse page and select the ‘Calculated’ tab and then the ‘Rating’ sub-tab. Next:
Once the Rating has been created, you can now specify what metrics you want to include in the rating and the weight of those metrics.
Click the edit icon
To add the Score or Rating metrics that you want to include in your Rating, click the ‘+ add metric’ button and use the filters to search through the list of suggested metrics.
To select a metric, tick the box next to the metric on the left side of the selection pane.
Once selected, the metric will move to the right side of the selection pane. To de-select, simply click the tick-box once more.
When you have selected all the metrics you want to include, click the ‘Add selected’ button.
Note: At this point your selection has not yet been saved. Only once you have clicked ‘Save and Close’ is your selection stored.
Now that you have made your metric selection, you can specify the weight you want to assign to the different Metrics.
Note: if you want the answers to all Metrics to be valued equally, you can tick the “equalize” box.
Finally click the ‘Save and Close’ button.
Descendant
A Descendant Metric inherits answers from one or more ancestor metrics. Descendant metrics are used to pool the data from a set of similar input metrics.
For example, when there are several standards that are asking the same question, like ‘what is the percentage of Women on the Board’, a Descendant Metric can combine the data from these different standards so that we can compare companies across these otherwise separate datasets.
To create a Descendant Metric, click the ‘Add Metric’ button on the Metrics browse page and select the ‘Calculated’ tab and then the ‘Descendant’ sub-tab. Next:
-
Add a Metric title that concisely describes what the Descendant Metric captures
-
Formulate the question that your metric aims to answer
-
Add any relevant Topics tags
-
Explain in the About section, the logic for rating companies in this way
-
Select the Value Type
Note: It is important that the Value Type of your input metrics is the same as each other and the same as the Value type of the Descendant metric. Is this not the case? Check out the Formula metrics guide for suggestions on how to convert a dataset to another Value Type.
-
(optional) If your Rating applies exclusively to a select number of Years or a specific Company Group add those.
-
(optional) If you are not ready for this Rating to be public you can set it to be “unpublished” and simply update that field to “publish” once it’s ready. Do note, that it will not be possible for other users to see or use this Score until it has been published.
-
Finally click “Submit”
Once the Descendant Metric has been created, you can now specify which input metrics you want to combine.
- Click the edit icon
- To add the Metrics that you want to include in your Descendant Metric, click the ‘+ add item’ button and use the filters to search through the list of suggested metrics.
- To select a metric, tick the box next to the metric on the left side of the selection pane. Once selected, the metric will move to the right side of the selection pane. To de-select, simply click the tick-box once more.
- When you have selected all the metrics you want to include, click the ‘Add selected’ button.
Note: At this point your selection has not yet been saved. Only once you have clicked ‘Save and Close’ is your selection stored.
Now that you have made your metric selection, you can specify the order in which you want the input metrics to be queried.
Note: Descendant metrics follow a data hierarchy. The input metric you list first will be queried first. If that metric does not have an answer for the company in question, it will query the next input metric. That also means, when multiple input metrics have an answer for the same company, the input metric that appears first in the list will take precedence.
- Finally click the ‘Save and Close’ button.
Formula
Like all Calculated Metric types, Formula metrics derive answers dynamically from the answers to other metrics. Formula metrics give you the flexibility to create formulae directly, while other calculated metric types have an interface for creating a specific type of formula.
More on how to create Formula metrics and examples of commonly used formulas coming soon.
Relation Metrics
Companies do not operate in isolation. They are connected to each other, and their decisions are shaped by and impact those related. It is therefore important that we capture these relationships and begin to map these networks of companies.
Relation metrics describe the relationship between two companies. Unlike other metrics on Wikirate, they can have compound answers, consisting of multiple relationships.
Each Relation has a corresponding Inverse Metric that allows you to see relationships from the opposite direction. For example if you had a metric "sells to", then its inverse might be "buys from". So if A sells to B, then B buys from A.
You can see the relation metrics on wikirate by filtering by metric type on the browse metric page. If the type of company relationship that you want to capture on Wikirate does not yet exist, you can create a new Relations metric.
To create a new Relation Metric, go to Add Metric.
Select the ‘Relation’ sub-tab and fill out the following fields:
-
-
Add the Metric title that concisely describes the type relationship that you want to capture, as well as the Inverse Metric title which is the inverse of that relationship (e.g. ‘Supplied by’, and ‘Supplier of’)
-
Formulate the question that your Metric aims to answer
-
Add any relevant Topics tags
-
Explain in the About section, why this relationship is important to capture
-
(optional) If your Metric applies exclusively to a select number of Years or a specific Company Group add those.
-
(optional) If you are not ready for this Metric to be public you can set it to be “unpublished” and simply update that field to “publish” once it’s ready. Do note, that it will not be possible for other users to see or use this Score until it has been published.
-
Finally click “Submit”
-
At the moment, Relation metric answers can only be imported. Wikirate has an import tool to help users bulk-import structured information.
Note: Importing large amounts of data can considerably modify our data sets. For this reason, the Wikirate team needs to supervise the import process.
If you wish to upload data to Wikirate, please contact us, and our team will guide you through it.
Network-aware Metrics
Besides that companies are connected to each other, they also have leverage over their business relations. It is therefore important that we can analyze their performance and impact across these relationships, and hold them accountable for the relations they engage in.
Network-aware metrics dynamically measure a company’s performance based on the performance of related companies (like suppliers, subsidiaries and brand partners), by combining Relation Metrics with other metric types in formulae.
An example of this would be the metric “Greenhouse gas disclosure rate of investees” which looks at what percentage of companies in an investors' portfolio have disclosed their greenhouse gas emissions.
More on how to create Network-aware metrics and examples of commonly used formulas coming soon!
Widgets
Wikirate Labs a site dedicated to sharing data experiments that Wikirate community members create using Wikirate data.
An experiment on Wikirate Labs can be any technical effort to generate something useful from Wikirate data.
With its open data structure, and it’s RESTful API, Wikirate makes it easy to develop widgets: dynamic interfaces that function like a window through which your community can engage with a specific dataset or research topic.
Different types of widgets are possible such as search or data visualizations tools (graphs, charts, maps) and they can be tailored to an audience.
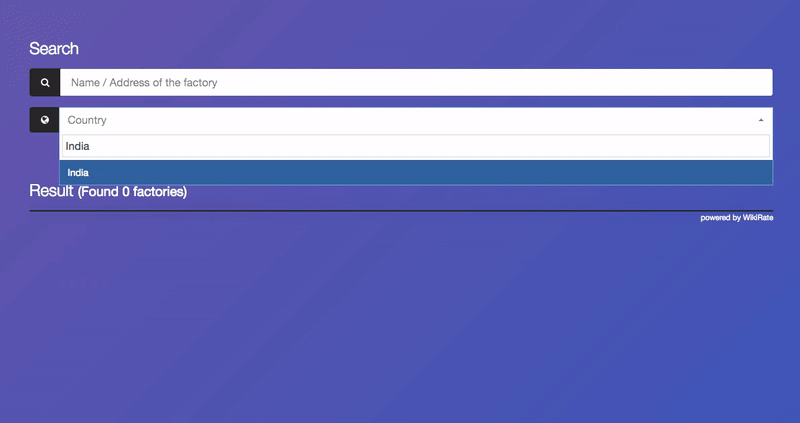
For example, the widget developed by Clean Clothes Campaign, that allows users to search for a factory and learn what brands it supplies. Live data comes directly via the Wikirate API.
Check out our current experiments, or add a new one here|here.
Got questions? Need support? Get in touch with us at info [at] wikirate.org